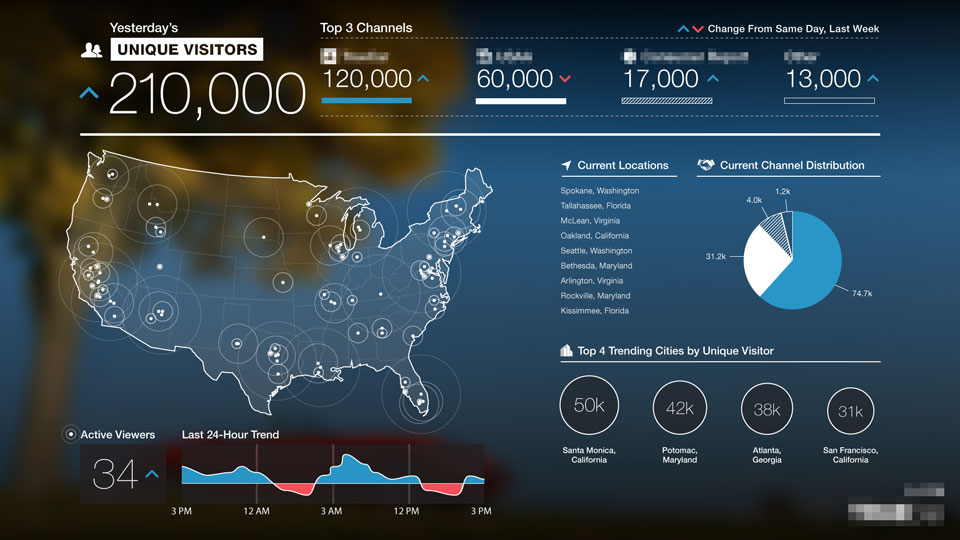
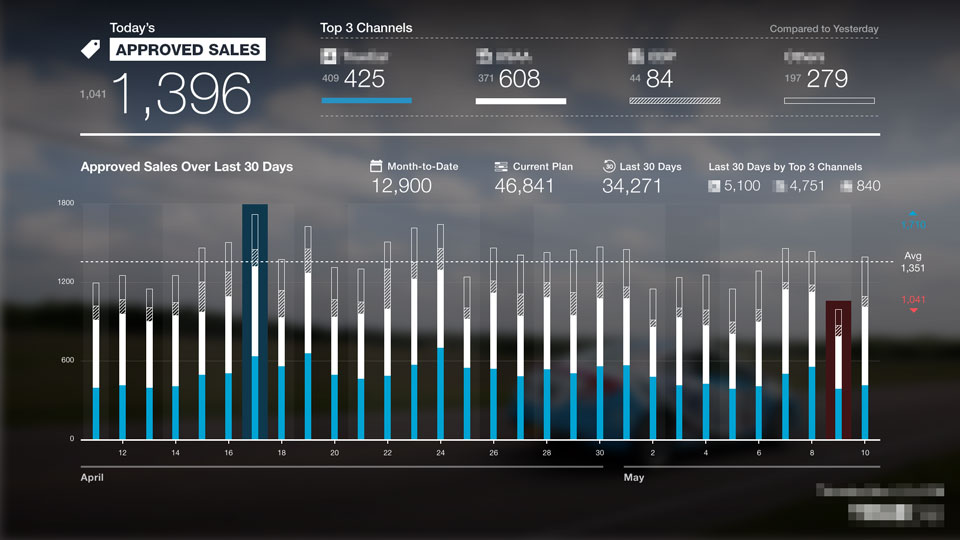
Boost Labs was asked to work on a project that would bring transparency to data and metrics from disparate departments across this large company. Our solution was a dashboard intended to be displayed on TV screens in a number of company buildings.
To accomplish the goal of unifying these datasets, we came up with the paradigm of screens for each department that move across the TV horizontally. Within the department screens we scroll through visualizations vertically, making sure by the design that insights can be easily derived.
Results
Leveraging Backbone views and Marionette layouts, I was really pleased with the amount of unification and DRY-ness that we were able to accomplish with the final application. We ended up doing a handful of super fast extensions to the dashboard for departments that wanted to be included, and really only needed to add in the additional data.
Challenges
One challenging requirement on this dashboard was the inclusion of real-time unique visitor data being collected by Adobe Omniture. I hadn't extracted data from Omniture before, so the API was interesting to figure out. Then with the real-time data in hand, we were presented with some initial performance issues since there were so many points to display. I ended up converting the initially SVG "ping map" into a Canvas implementation, which luckily improved the performance (removing ~10,000 DOM elements really helped).
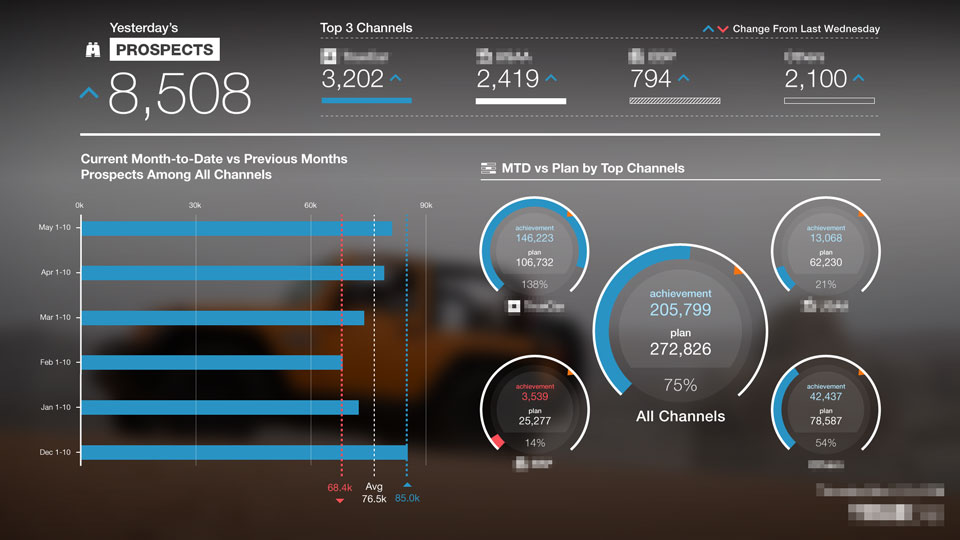
Bonus Projects!
We worked on some other really cool projects for this client, such as this snippet of a presentation for the Detroit Auto Show. I worked on developing some prototypes and MVPs that we used in the presentation via screenshots & videos. There was a particular focus on animating the introduction of new data points, and using transitions to tell as much of a story as the static views.