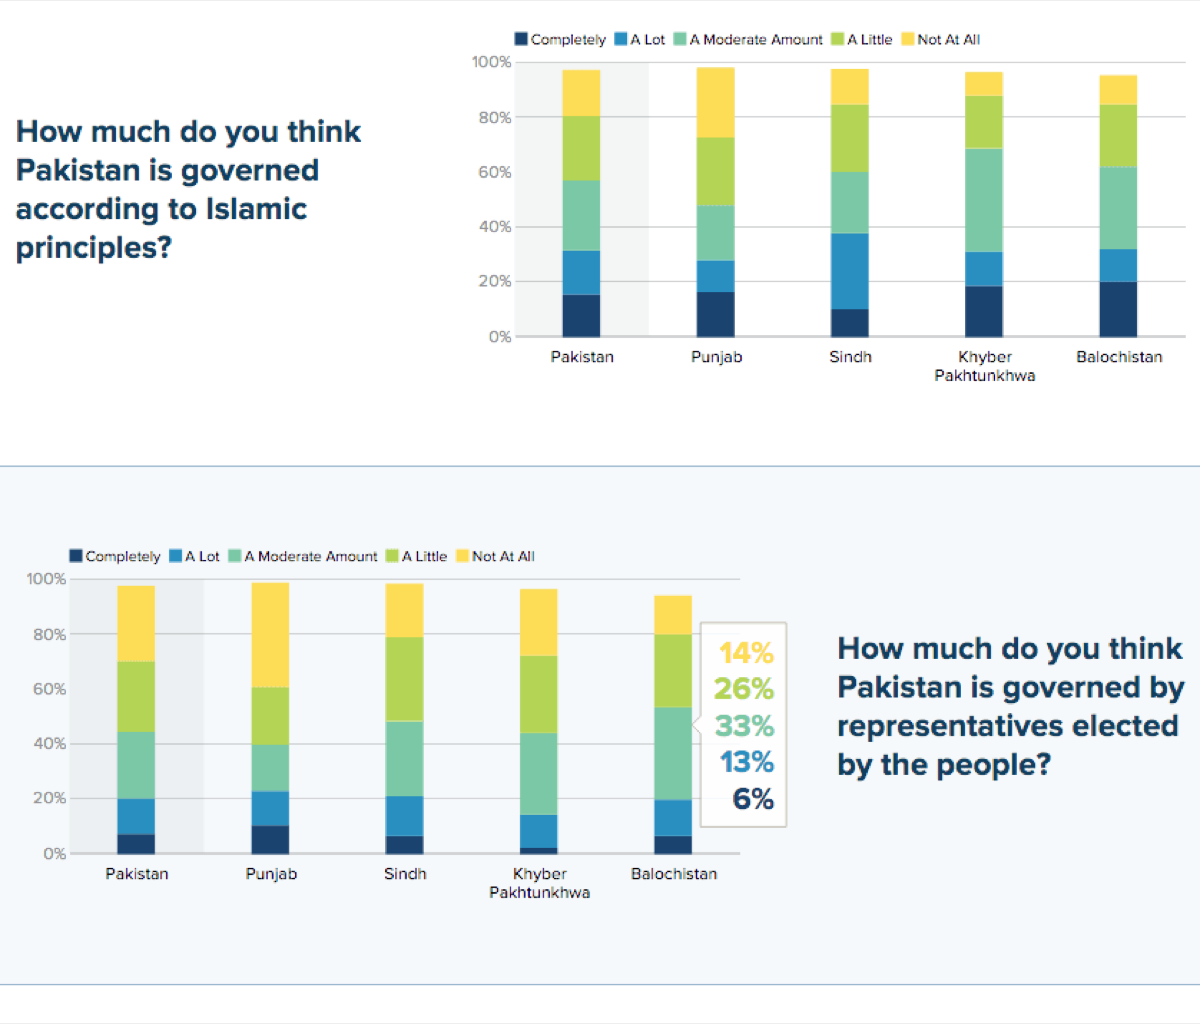
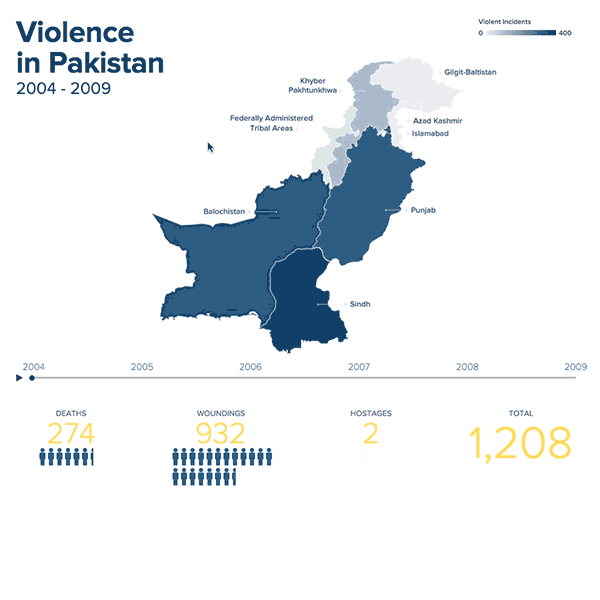
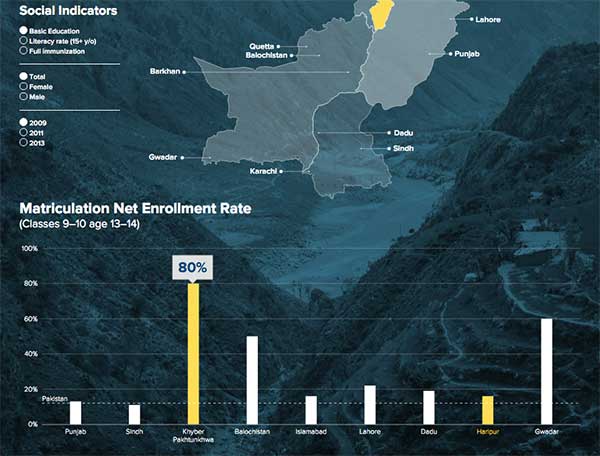
The National Bureau of Asian Research (NBR) came to Boost Labs looking for a visualization that would support their recent survey activity in Pakistan by enhancing the transparency and availability of their data.
Our solution, architected by an inter-disciplinary team of designers and developers, was a set of interactive charts that enabled users to view each data source from multiple angles (NBR was especially interested in seeing the data for Pakistan as a country and when broken down by region). We leveraged D3, Sass, and some PHP to build the interactive chart modules that NBR has been able to embed in the Wordpress websites that they use to publicize their results.